
Sales Insights
“Leads come in many ways, but it’s the aggregate that matters.”
— Danilo Nikolich, VP of Sales
◆ Unified Sales & Marketing ◆ Streamlined Workflows ◆ Increased Revenue Growth
The Challenge
The Solution
The Impact
At RollWorks, I redesigned Sales Insights, a Salesforce-embedded tool helping sales teams identify in-market accounts and key contacts. By simplifying workflows and surfacing intent data, adoption soared, churn dropped, and customers achieved higher contract values through a streamlined, data-driven approach to sales and marketing alignment.
Project Length: 4 months
Category: Marketing/Sales SaaS
Tags: Design Thinking, User Testing, Go To Market
About this Case Study

Key Stats:
40% increase in user adoption within six months.
25% reduction in time spent qualifying accounts.
2.5x growth in average contract value for engaged customers.
30% decrease in churn for customers using Sales Insights.
Sales teams often lacked clarity on who to reach out to each day, leading to wasted time and missed opportunities. RollWorks’ existing Spike Model could identify accounts showing unusually high interest, but adoption of the CRM widget remained low.
The Challenge

Soooooo Many Different Screens
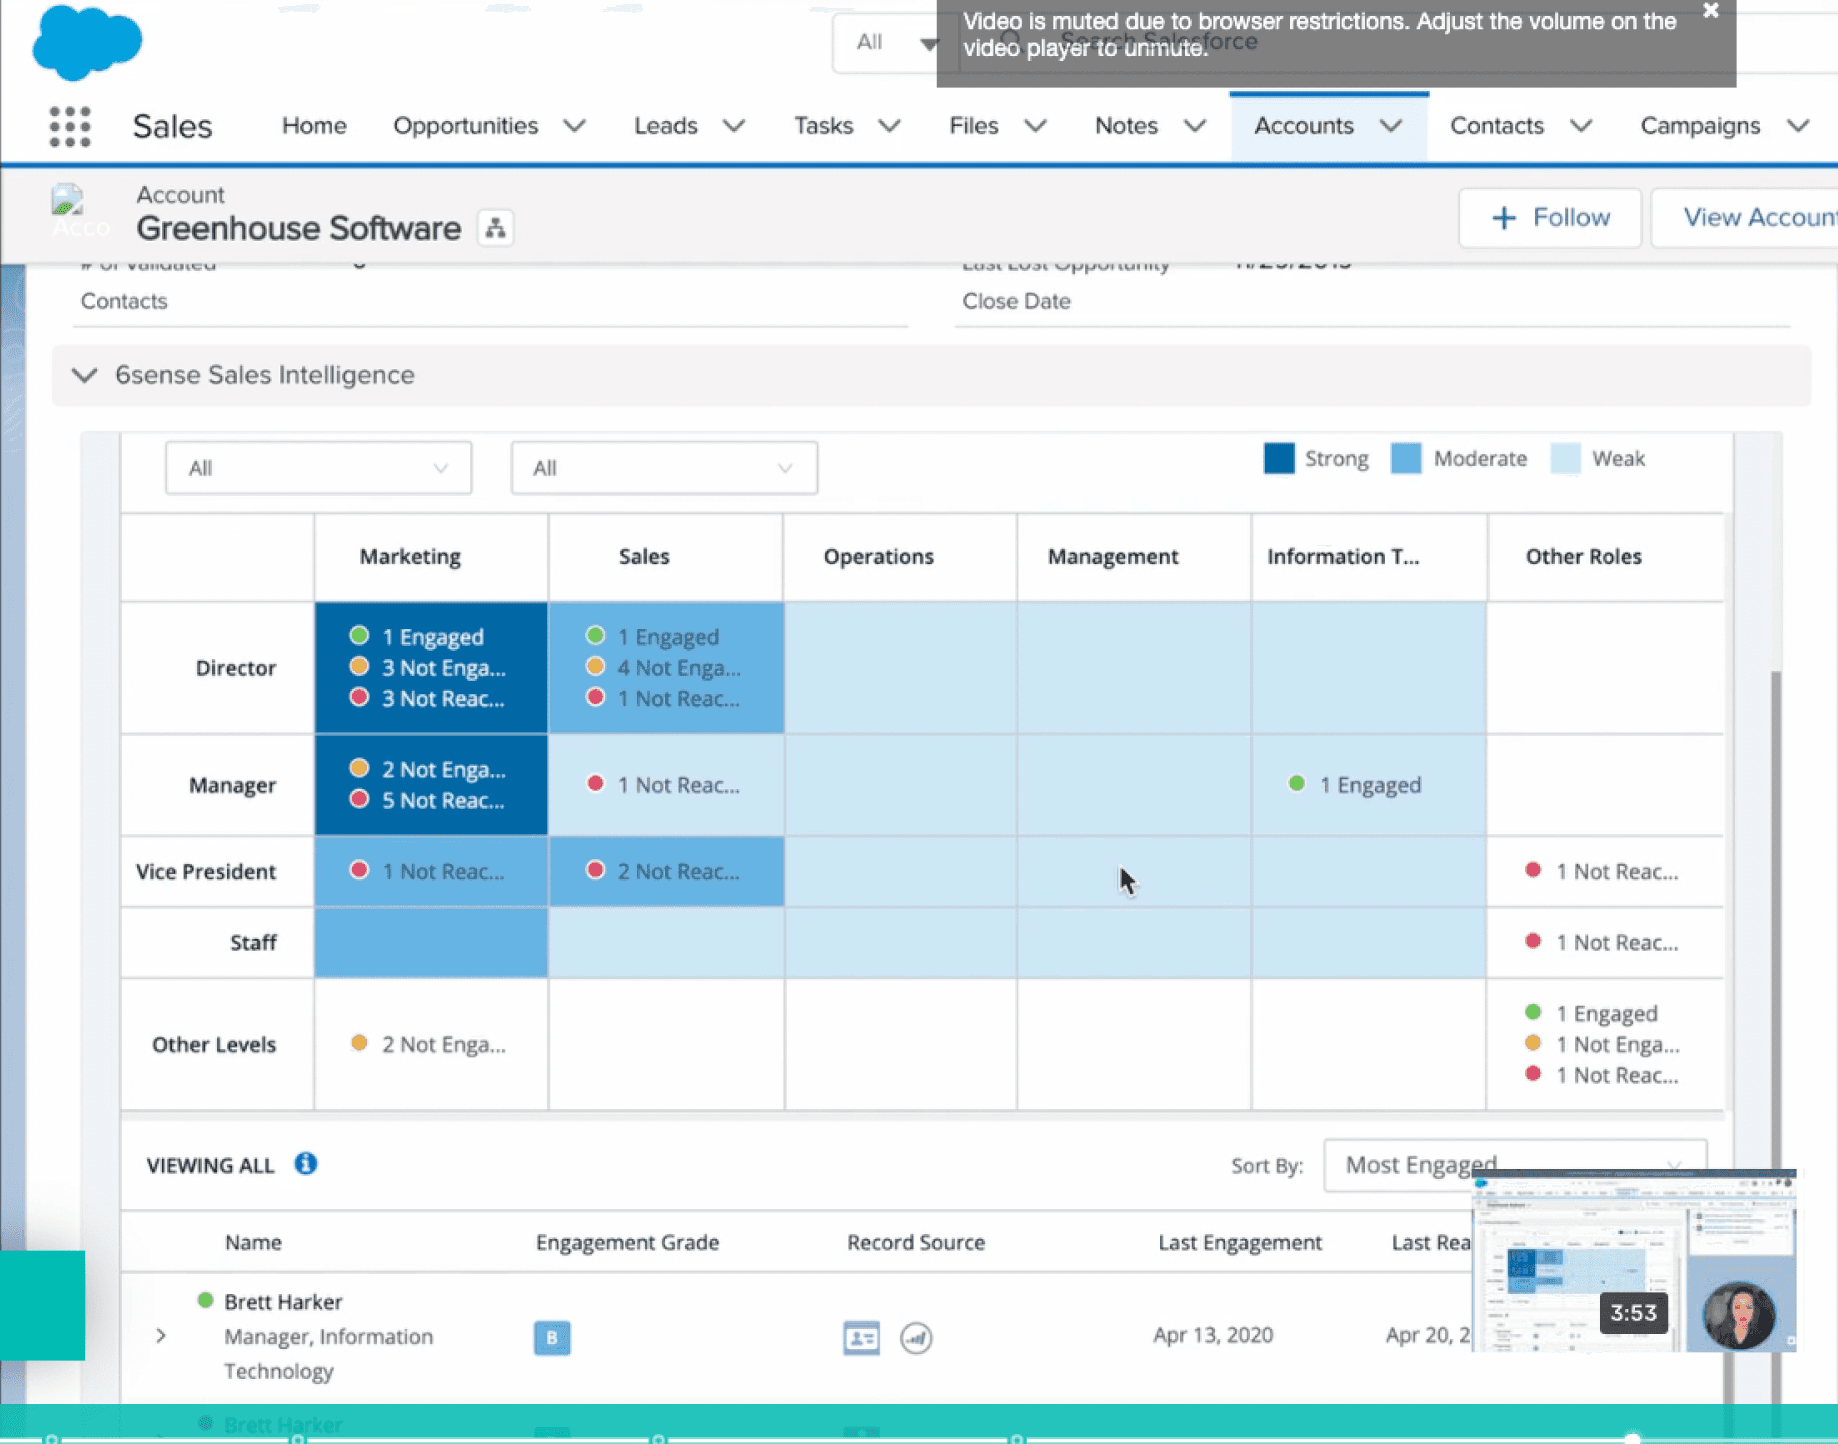
Many different screens in three different location contained very useful data, but no through-line was obvious for SDRs to know who to reach out to, when, and why.

Salesforce table, Salesforce RollWorks widget, email, and the actual RollWorks web product itself.
Initial Research Findings
Through interviews with Sales Development Representatives (SDRs), we uncovered the following key issues:
Confusion about which accounts were fresh or worked.
Mismatched data between emails, the CRM, and Spike summaries.
Disconnected links and navigation paths causing friction.
Noisy activity streams that overwhelmed users.
This research revealed a huge opportunity: customers actively using Sales Insights had the lowest churn rates and largest contract values.
The challenge became clear — make Sales Insights essential to daily workflows.

Keeping Track of Research
One of my roles as Senior Product Designer is to capture the information we are learning and presenting it in a way that makes sense.
I kept track of our learnings in Figjam

Job To Be Done
When starting my day, I want to prioritize which people at my accounts to reach out to in an informed way, so that I can save time and reach out when they are most likely to respond to me.
Competitive Analysis
We went through all of our competitors and took stock of table stakes. What did we need to make sure that we launched? What could we launch that would be new to the market?


Projects are always better with furry friends
Meet The Team


Cat*
Joe Valley

Jaclyn Klein

Chuck is the Product Manager
Jaclyn is the Director of Design
This is me, Joe. I am the Product Designer
Mark is the Manager of Product Mangers
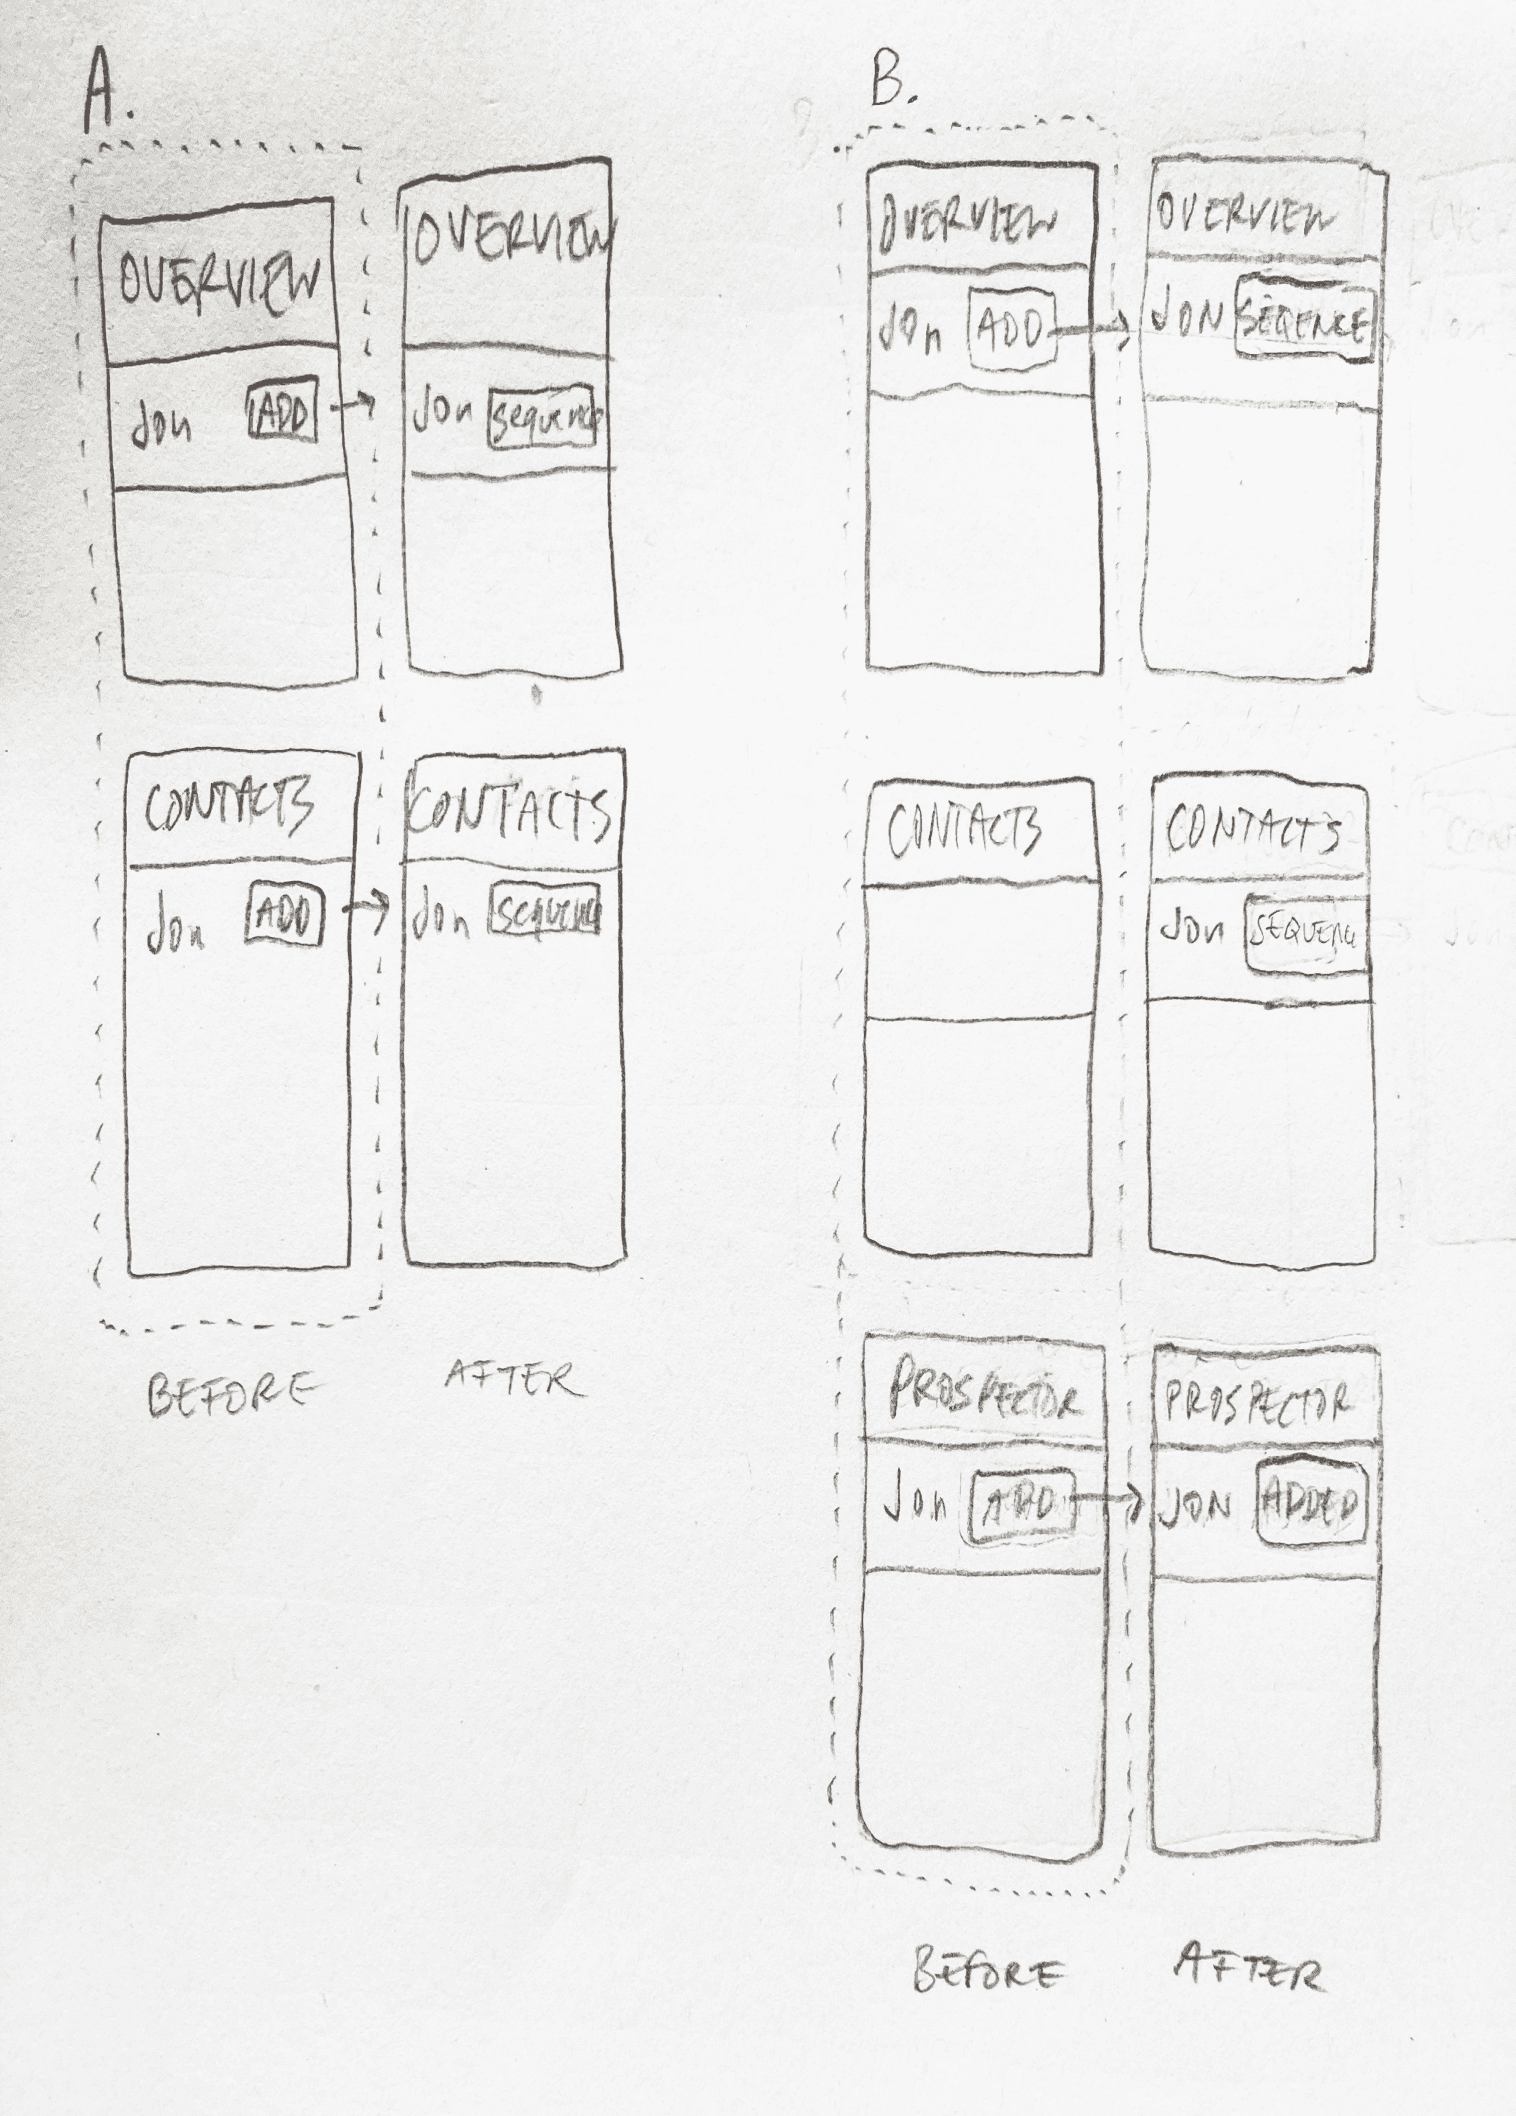
Surfacing people at a company is great because it gives you a way to connect with the account. Sometimes those people are already in your CRM. Sometimes they are not. We’d need to give people a way to keep track of that. I drew out the model of data to see best way to move forward.
Known and Unknown Contacts

Thinking on paper
If you look at this diagram for a while, you’ll see that “adding” a contact to your CRM, a Sequence, or to your RollWorks approved contact list has some weird logic, which is a result of the different states a contact can be in:
In CRM: yes/no
In RollWorks approved contact: list yes/no
In Outreach Sequence: yes/no
Changes you make to a contact in one place changes them in another place. How do you keep track of that? You’ll see later in the solution that I came up with a drawer that would persist across tabs.
I Found a Fundamental Challenge

The whole point was reducing the noise, so showing SDRs every contact related to an account wasn’t the move. We needed an overview tab to show most relevant people, but we also needed a way for SDRs to drill down into a full table of folks. I drew up an idea for a page that contained all the contacts for a particular account.
Tabs for Contacts & Overview

All contacts
How would we show which people are already in CRM? How would we show recommended contacts? How would we delineate between those who are Hot Contacts? I mocked up chips that could identify how a contact fit a certain category.
Data Gets Messy Fast

Would recommended contacts be automatically surfaced to the top?
Would “Hot” still be a badge?
Would there be other badges?
Result
F
i
n
a
l
I had the sense during our interviews with sales executives that it was valuable to show all relevant data on one screen instead of across five tabs. I took that idea and ran with it, which was very well received both internally and with users.
We knew that once people confirmed an account was good for outreach, the next thing they’d be doing is finding the right person. All that can happen right here on the Overview tab.
Let’s Go With a Dashboard
The Solution

Overview Tab



Before
After
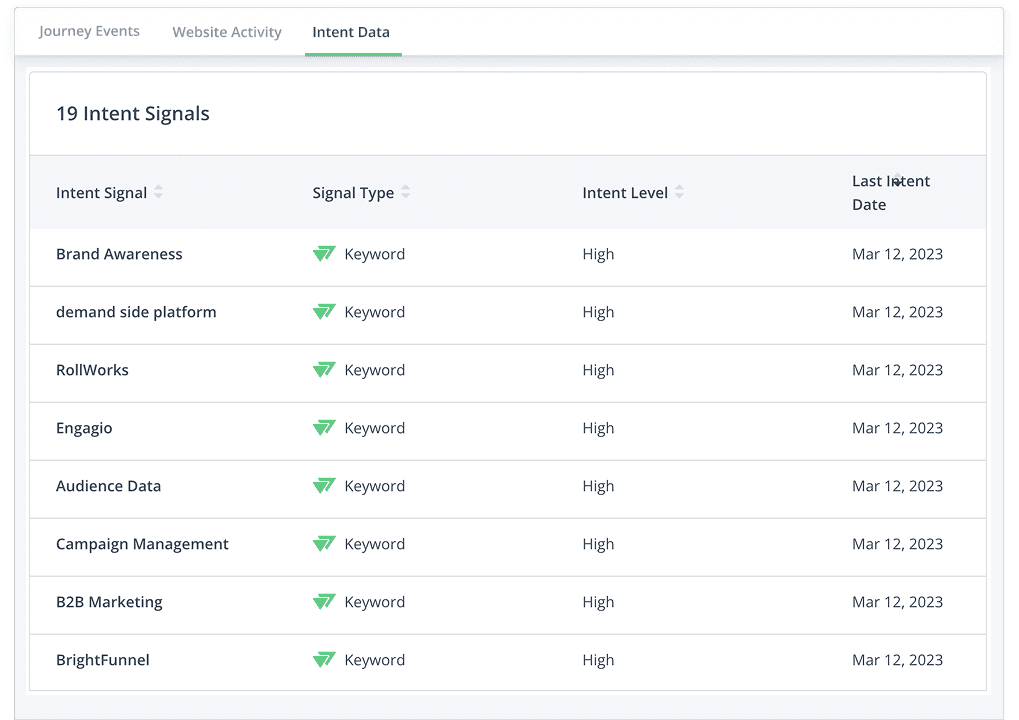
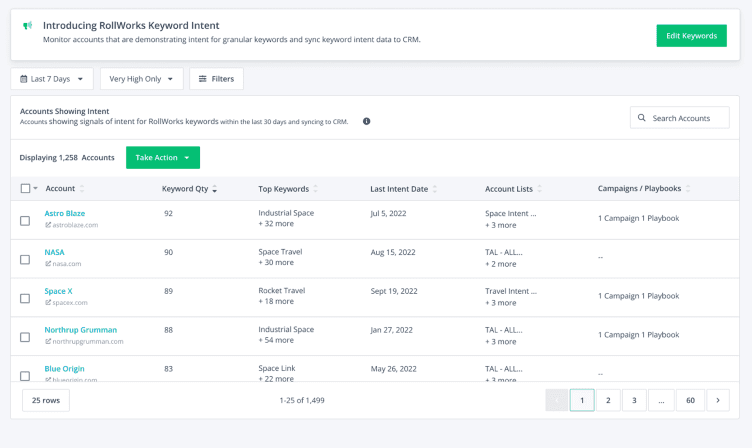
From six (6) different screens down to one (1). It is the key information that SDRs said they wanted all in one place.
Product Demo
Watch Demo for Hot Contacts

The whole buying committee could be revealed upon further investigation. Everyone at a company can be seen at once along with activity. Sometimes no activity is the best signal of all. Time for outreach.
Ability to Drill Down

I came up with the idea of a “Contact Drawer” that held a contact’s details and relevant actions which could stay as a discrete place that appears in multiple locations.
A Drawer to Rule Them All

A contact’s record can be found in different places, and a drawer allows that record to be pulled up no matter where it’s at.
I put in chips for contact activity to show at a glance what activity is relevant. A blue hyperlink opens up a small dialogue with the list of other actions.
The Overview tab contained the top Intent signals, which let you know what someone is searching for already. Our Intent model show just how interested they are for specific keywords. SDRs could drill down to see allllllll the Intent signals on its own tab.
What Makes Them Hot

Since we made the tool right inside Salesforce where the sales executives are already working, they didn’t even need to go to the RollWorks website. Clicking on a person’s name opens up their activity at a glance.
What Are Those Folks Up To?

Having an engineering partner like Matt Burch is highly, highly recommended. Five stars. Go out right now and get a Matt Burch so that you turn your vision into reality.
Matt and I had been in conversations for months about the technical feasibility of our design ideas, so when we got to a green light to build our vision, Matt was already well underway.
Going Into Development

The Impact
Driving Growth & Retention
The redesigned Sales Insights tool transformed how sales teams worked. By removing friction and centralizing data, we delivered a solution that directly impacted revenue.

Key Business Outcomes:
Increased user adoption across target accounts.
Dramatically reduced wasted time spent hunting for information.
Improved alignment between sales and marketing teams.
Boosted contract values by surfacing the right opportunities.

Key Insight:
True success comes from solving core workflow problems, not just adding new features.
By focusing on the job to be done, we built something sales teams couldn’t live without.
Key Stats:
40% increase in user adoption within six months.
25% reduction in time spent qualifying accounts.
2.5x growth in average contract value for engaged customers.
30% decrease in churn for customers using Sales Insights.
Next Case Study
Onwards
Next Case Study
Onwards
Key Stats:
40% increase in user adoption within six months.
25% reduction in time spent qualifying accounts.
2.5x growth in average contract value for engaged customers.
30% decrease in churn for customers using Sales Insights.

Key Insight:
True success comes from solving core workflow problems, not just adding new features.
By focusing on the job to be done, we built something sales teams couldn’t live without.

Key Business Outcomes:
Increased user adoption across target accounts.
Dramatically reduced wasted time spent hunting for information.
Improved alignment between sales and marketing teams.
Boosted contract values by surfacing the right opportunities.
The Impact
Driving Growth & Retention
The redesigned Sales Insights tool transformed how sales teams worked. By removing friction and centralizing data, we delivered a solution that directly impacted revenue.
Having an engineering partner like Matt Burch is highly, highly recommended. Five stars. Go out right now and get a Matt Burch so that you turn your vision into reality.
Matt and I had been in conversations for months about the technical feasibility of our design ideas, so when we got to a green light to build our vision, Matt was already well underway.
Going Into Development

Since we made the tool right inside Salesforce where the sales executives are already working, they didn’t even need to go to the RollWorks website. Clicking on a person’s name opens up their activity at a glance.
What Are Those Folks Up To?
The Overview tab contained the top Intent signals, which let you know what someone is searching for already. Our Intent model show just how interested they are for specific keywords. SDRs could drill down to see allllllll the Intent signals on its own tab.
What Makes Them Hot
I put in chips for contact activity to show at a glance what activity is relevant. A blue hyperlink opens up a small dialogue with the list of other actions.
I came up with the idea of a “Contact Drawer” that held a contact’s details and relevant actions which could stay as a discrete place that appears in multiple locations.
A Drawer to Rule Them All

A contact’s record can be found in different places, and a drawer allows that record to be pulled up no matter where it’s at.
The whole buying committee could be revealed upon further investigation. Everyone at a company can be seen at once along with activity. Sometimes no activity is the best signal of all. Time for outreach.
Ability to Drill Down
Product Demo
Watch Demo for Hot Contacts


Before
After
From six (6) different screens down to one (1). It is the key information that SDRs said they wanted all in one place.
I had the sense during our interviews with sales executives that it was valuable to show all relevant data on one screen instead of across five tabs. I took that idea and ran with it, which was very well received both internally and with users.
We knew that once people confirmed an account was good for outreach, the next thing they’d be doing is finding the right person. All that can happen right here on the Overview tab.
Let’s Go With a Dashboard
The Solution

How would we show which people are already in CRM? How would we show recommended contacts? How would we delineate between those who are Hot Contacts? I mocked up chips that could identify how a contact fit a certain category.
Data Gets Messy Fast

The whole point was reducing the noise, so showing SDRs every contact related to an account wasn’t the move. We needed an overview tab to show most relevant people, but we also needed a way for SDRs to drill down into a full table of folks. I drew up an idea for a page that contained all the contacts for a particular account.
Tabs for Contacts & Overview

If you look at this diagram for a while, you’ll see that “adding” a contact to your CRM, a Sequence, or to your RollWorks approved contact list has some weird logic, which is a result of the different states a contact can be in:
In CRM: yes/no
In RollWorks approved contact: list yes/no
In Outreach Sequence: yes/no
Changes you make to a contact in one place changes them in another place. How do you keep track of that? You’ll see later in the solution that I came up with a drawer that would persist across tabs.
I Found a Fundamental Challenge

Surfacing people at a company is great because it gives you a way to connect with the account. Sometimes those people are already in your CRM. Sometimes they are not. We’d need to give people a way to keep track of that. I drew out the model of data to see best way to move forward.
Known and Unknown Contacts

Projects are always better with furry friends
Meet The Team


Cat*
Joe Valley

Jaclyn Klein

Chuck is the Product Manager
Jaclyn is the Director of Design
This is me, Joe. I am the Product Designer
Mark is the Manager of Product Mangers
Competitive Analysis
We went through all of our competitors and took stock of table stakes. What did we need to make sure that we launched? What could we launch that would be new to the market?
Job To Be Done
When starting my day, I want to prioritize which people at my accounts to reach out to in an informed way, so that I can save time and reach out when they are most likely to respond to me.
Keeping Track of Research
One of my roles as Senior Product Designer is to capture the information we are learning and presenting it in a way that makes sense.
Initial Research Findings
Through interviews with Sales Development Representatives (SDRs), we uncovered the following key issues:
Confusion about which accounts were fresh or worked.
Mismatched data between emails, the CRM, and Spike summaries.
Disconnected links and navigation paths causing friction.
Noisy activity streams that overwhelmed users.
This research revealed a huge opportunity: customers actively using Sales Insights had the lowest churn rates and largest contract values.
The challenge became clear — make Sales Insights essential to daily workflows.

Soooooo Many Different Screens
Many different screens in three different location contained very useful data, but no through-line was obvious for SDRs to know who to reach out to, when, and why.

Salesforce table, Salesforce RollWorks widget, email, and the actual RollWorks web product itself.
Sales teams often lacked clarity on who to reach out to each day, leading to wasted time and missed opportunities. RollWorks’ existing Spike Model could identify accounts showing unusually high interest, but adoption of the CRM widget remained low.
The Challenge
Key Stats:
40% increase in user adoption within six months.
25% reduction in time spent qualifying accounts.
2.5x growth in average contract value for engaged customers.
30% decrease in churn for customers using Sales Insights.
The Challenge
The Solution
The Impact
At RollWorks, I redesigned Sales Insights, a Salesforce-embedded tool helping sales teams identify in-market accounts and key contacts. By simplifying workflows and surfacing intent data, adoption soared, churn dropped, and customers achieved higher contract values through a streamlined, data-driven approach to sales and marketing alignment.
Project Length: 4 months
Category: Marketing/Sales SaaS
Tags: Design Thinking, User Testing, Go To Market
About this Case Study


The Challenge
The Solution
The Impact
At RollWorks, I redesigned Sales Insights, a Salesforce-embedded tool helping sales teams identify in-market accounts and key contacts. By simplifying workflows and surfacing intent data, adoption soared, churn dropped, and customers achieved higher contract values through a streamlined, data-driven approach to sales and marketing alignment.
Project Length: 4 months
Category: Marketing/Sales SaaS
Tags: Design Thinking, User Testing, Go To Market
About this Case Study

Key Stats:
40% increase in user adoption within six months.
25% reduction in time spent qualifying accounts.
2.5x growth in average contract value for engaged customers.
30% decrease in churn for customers using Sales Insights.
Sales teams often lacked clarity on who to reach out to each day, leading to wasted time and missed opportunities. RollWorks’ existing Spike Model could identify accounts showing unusually high interest, but adoption of the CRM widget remained low.
The Challenge

Salesforce table, Salesforce RollWorks widget, email, and the actual RollWorks web product itself.
Soooooo Many Different Screens
Many different screens in three different location contained very useful data, but no through-line was obvious for SDRs to know who to reach out to, when, and why.

Initial Research Findings
Through interviews with Sales Development Representatives (SDRs), we uncovered the following key issues:
Confusion about which accounts were fresh or worked.
Mismatched data between emails, the CRM, and Spike summaries.
Disconnected links and navigation paths causing friction.
Noisy activity streams that overwhelmed users.
This research revealed a huge opportunity: customers actively using Sales Insights had the lowest churn rates and largest contract values.
The challenge became clear — make Sales Insights essential to daily workflows.

Keeping Track of Research
One of my roles as Senior Product Designer is to capture the information we are learning and presenting it in a way that makes sense.
Job To Be Done
When starting my day, I want to prioritize which people at my accounts to reach out to in an informed way, so that I can save time and reach out when they are most likely to respond to me.
Competitive Analysis
We went through all of our competitors and took stock of table stakes. What did we need to make sure that we launched? What could we launch that would be new to the market?
Meet The Team


Cat*


Chuck is the Product Manager
Jaclyn is the Director of Design
This is me, Joe. I am the Product Designer
Mark is the Manager of Product Mangers
Projects are always better with furry friends
Known and Unknown Contacts
Surfacing people at a company is great because it gives you a way to connect with the account. Sometimes those people are already in your CRM. Sometimes they are not. We’d need to give people a way to keep track of that. I drew out the model of data to see best way to move forward.
Thinking on paper

I Found a Fundamental Challenge
If you look at this diagram for a while, you’ll see that “adding” a contact to your CRM, a Sequence, or to your RollWorks approved contact list has some weird logic, which is a result of the different states a contact can be in:
In CRM: yes/no
In RollWorks approved contact: list yes/no
In Outreach Sequence: yes/no
Changes you make to a contact in one place changes them in another place. How do you keep track of that? You’ll see later in the solution that I came up with a drawer that would persist across tabs.

Tabs for Contacts & Overview
The whole point was reducing the noise, so showing SDRs every contact related to an account wasn’t the move. We needed an overview tab to show most relevant people, but we also needed a way for SDRs to drill down into a full table of folks. I drew up an idea for a page that contained all the contacts for a particular account.
Data Gets Messy Fast

Would recommended contacts be automatically surfaced to the top?
Would “Hot” still be a badge?
Would there be other badges?
How would we show which people are already in CRM? How would we show recommended contacts? How would we delineate between those who are Hot Contacts? I mocked up chips that could identify how a contact fit a certain category.
I had the sense during our interviews with sales executives that it was valuable to show all relevant data on one screen instead of across five tabs. I took that idea and ran with it, which was very well received both internally and with users.
We knew that once people confirmed an account was good for outreach, the next thing they’d be doing is finding the right person. All that can happen right here on the Overview tab.
Let’s Go With a Dashboard
The Solution

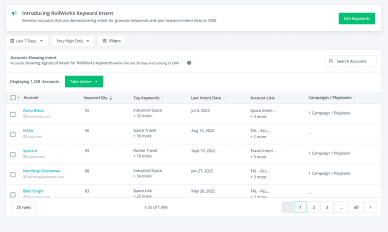
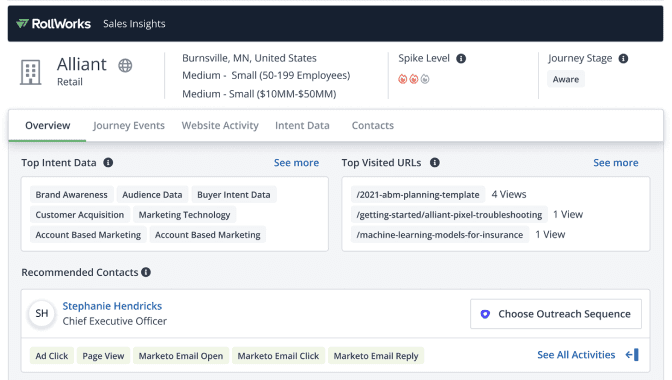
Before
After
From six (6) different screens down to one (1). It is the key information that SDRs said they wanted all in one place.
Product Demo
Watch Demo for Hot Contacts
The whole buying committee could be revealed upon further investigation. Everyone at a company can be seen at once along with activity. Sometimes no activity is the best signal of all. Time for outreach.
Ability to Drill Down
I came up with the idea of a “Contact Drawer” that held a contact’s details and relevant actions which could stay as a discrete place that appears in multiple locations.
A Drawer to Rule Them All

A contact’s record can be found in different places, and a drawer allows that record to be pulled up no matter where it’s at.
I put in chips for contact activity to show at a glance what activity is relevant. A blue hyperlink opens up a small dialogue with the list of other actions.
The Overview tab contained the top Intent signals, which let you know what someone is searching for already. Our Intent model show just how interested they are for specific keywords. SDRs could drill down to see allllllll the Intent signals on its own tab.
What Makes Them Hot
Since we made the tool right inside Salesforce where the sales executives are already working, they didn’t even need to go to the RollWorks website. Clicking on a person’s name opens up their activity at a glance.
What Are Those Folks Up To?
Going Into Development
Having an engineering partner like Matt Burch is highly, highly recommended. Five stars. Go out right now and get a Matt Burch so that you turn your vision into reality.
Matt and I had been in conversations for months about the technical feasibility of our design ideas, so when we got to a green light to build our vision, Matt was already well underway.

The Impact
Driving Growth & Retention
The redesigned Sales Insights tool transformed how sales teams worked. By removing friction and centralizing data, we delivered a solution that directly impacted revenue.
Key Business Outcomes:
Increased user adoption across target accounts.
Dramatically reduced wasted time spent hunting for information.
Improved alignment between sales and marketing teams.
Boosted contract values by surfacing the right opportunities.
Key Insight:
True success comes from solving core workflow problems, not just adding new features.
By focusing on the job to be done, we built something sales teams couldn’t live without.

Key Stats:
40% increase in user adoption within six months.
25% reduction in time spent qualifying accounts.
2.5x growth in average contract value for engaged customers.
30% decrease in churn for customers using Sales Insights.
Next Case Study
Onwards